
Why separate fitness and freshness
A typical week for an amateur runner: intervals on Tuesday, tempo on Thursday, long run on Saturday. In between — easy runs or rest. By the end of the week, legs feel heavy and your usual pace is harder to hold. It seems like fitness has dropped. But over that week, you could have become fitter — it's just that accumulated fatigue is masking it.
The opposite also happens: after a week off, it feels like "everything is lost." In reality, a short rest may primarily clear fatigue, while the fitness built over months is almost entirely retained. Another classic mistake is adding work before a race "for confidence" and showing up tired.
In the "Form and fatigue" card, we separate these processes:
- CTL — fitness: a slowly changing level of accumulated training load, a conventional indicator of preparedness.
- ATL — fatigue: a rapidly changing response to recent load.
- TSB — freshness: the difference between fitness and fatigue.
Let me immediately point out where the model lies: it only sees recorded workouts. It knows nothing about sleep, work, stress, illness, or nutrition. Two people with the same CTL can be in completely different states. This is a scale for talking about load, not a diagnosis or a direct measurement of athletic fitness.
How we calculate it
One scale for different workouts
We bring running, cycling, swimming, and heart-rate-based sports to a common reference point:
100 points = one hour at your threshold
One hour at threshold means an intensity of IF = 1.0 and exactly 100 points — regardless of the sport. This is not a claim that the effect on muscles is the same: swimming and running load the body differently. It is a single scale on which you can add up workouts and build an overall load history.
We choose the formula based on the data: first power for cycling, then pace with threshold pace for running, speed with critical speed for swimming. If suitable data is not available, we use heart rate.
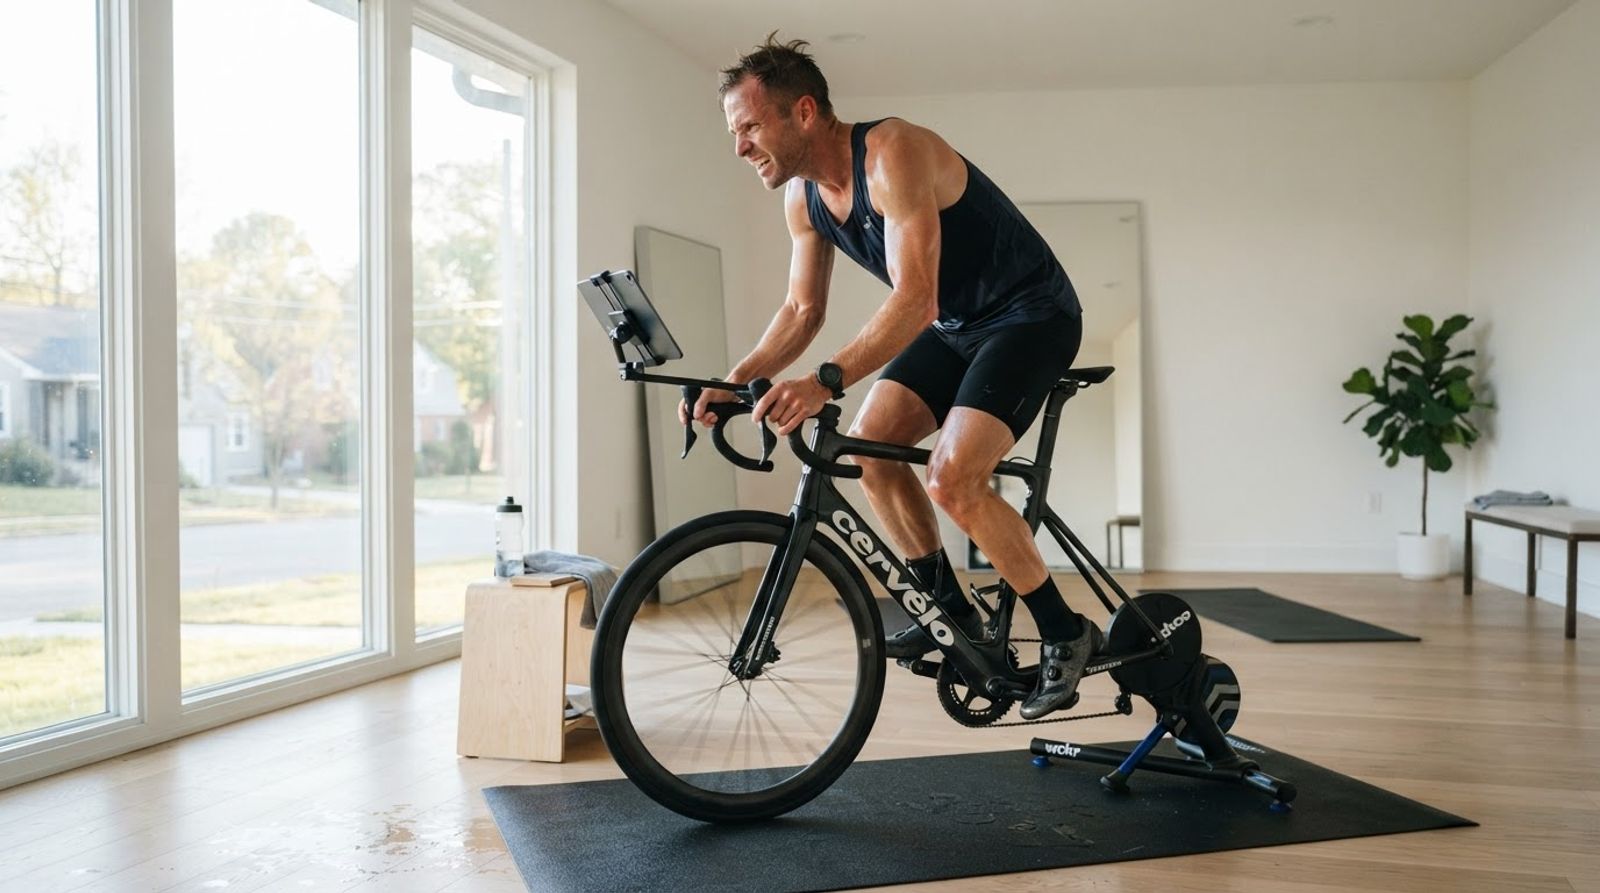
Cycling: power → NP → IF → TSS. The approach by Andrew Coggan and Hunter Allen is described in Training and Racing with a Power Meter (2006). Normalized power NP accounts for the fact that erratic efforts are harder than steady ones at the same average power. The classic definition:
NP = (average of the 30-second rolling average of power to the 4th power)^(1/4)
IF = NP / FTP
TSS = seconds · IF² / 3600 · 100
FTP is the athlete's threshold power. First we estimate intensity relative to their threshold, then we account for duration. The limitation of our NP implementation — calculation by segments instead of a second-by-second stream — I will cover below.
Running: pace → grade adjustment → rTSS. Here we use the approach by Philip Skiba (2006):
IF = normalized equivalent flat speed / threshold speed
rTSS = seconds · IF² / 3600 · 100
For the grade adjustment we use the polynomial by Minetti et al. from Energy cost of walking and running at extreme uphill and downhill slopes (2002). It describes the energy cost of running at different grades. A slow climb is converted into an equivalent flat speed: otherwise a hard uphill run would look like an easy workout just because of the pace.
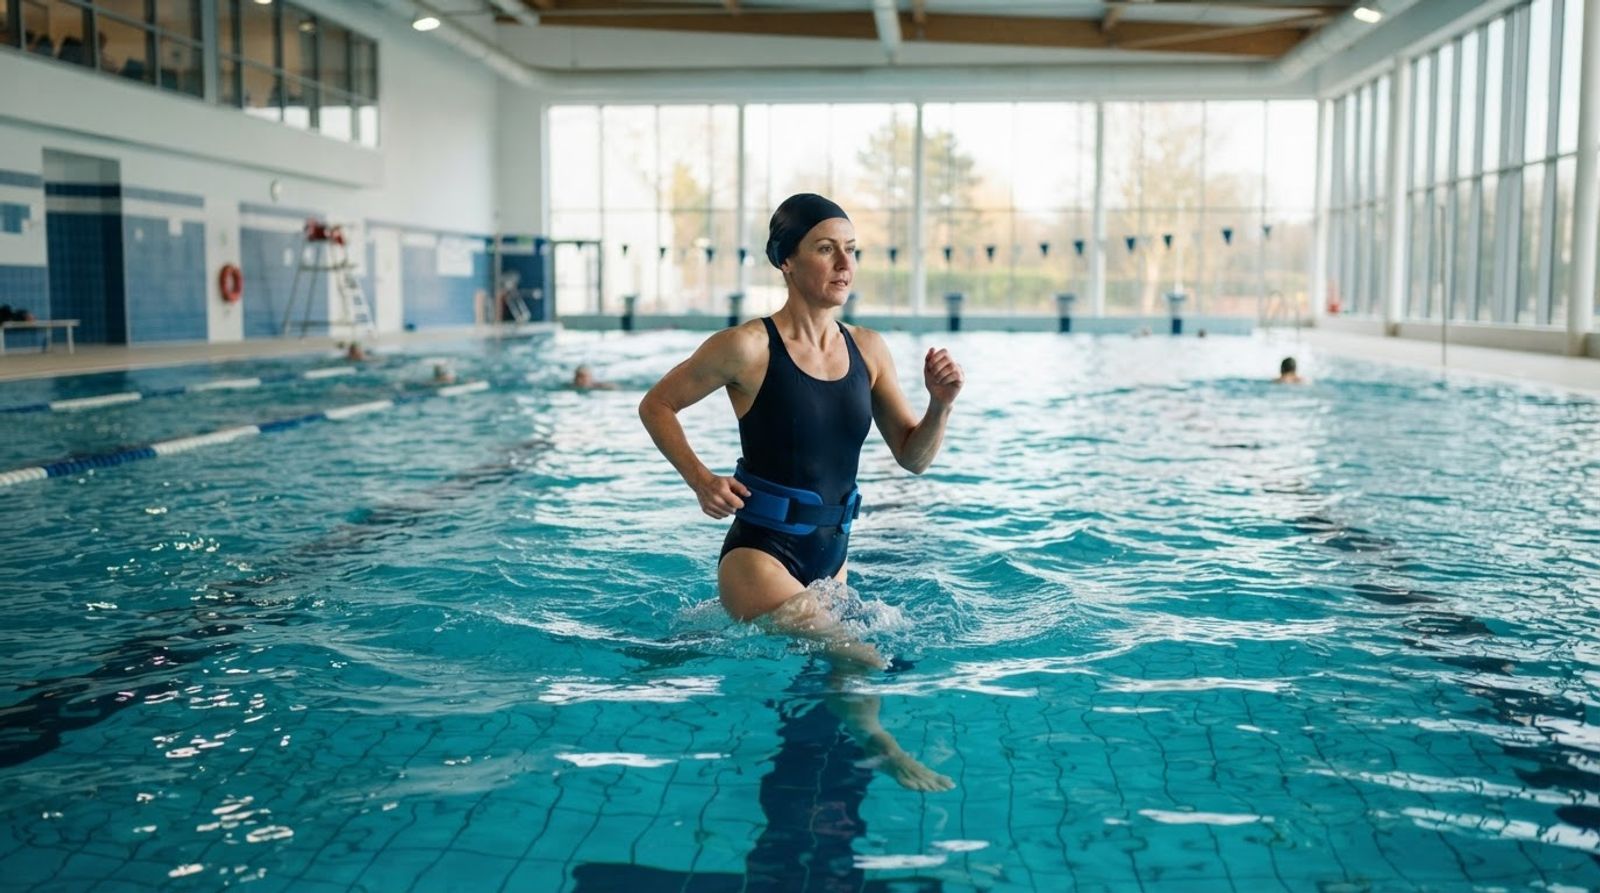
Swimming: speed → CSS → sTSS. CSS is critical swim speed, the approach by Wakayoshi et al. (1992). For load we use the approach by Skiba, SwimScore (2006):
IF = speed / CSS
sTSS = seconds · IF³ / 3600 · 100
Here it's cubed, not squared. Water resistance grows roughly as the square of speed, while the required power grows as the cube. So swimming 10% faster for the same duration costs about 33% more under this model.
Heart rate only: TRIMP normalized to threshold. The basis is exponential TRIMP: Banister (1991), Morton, Fitz-Clarke and Banister (1990).
HRr = (heart rate − resting heart rate) / (maximum heart rate − resting heart rate)
TRIMP = minutes · HRr · 0.64 · e^(k · HRr)
The coefficient k = 1.92 for men and 1.67 for women — coefficients from Green et al. HRr shows what share of heart rate reserve the effort occupies.
Raw TRIMP is not comparable to TSS or between people. So we separately calculate the TRIMP for the same person over 60 minutes at their lactate threshold heart rate:
load = TRIMP of workout / TRIMP of an hour at your lactate threshold heart rate · 100
This way the heart rate estimate also gets a reference point of "an hour at threshold = 100", rather than just a new name for raw TRIMP.
Where the threshold comes from
The whole scale depends on the threshold: power, speed or heart rate — depending on the formula. An underestimated threshold inflates the load, an overestimated one deflates it. So we set an explicit priority of sources.
- A test-confirmed or manually entered threshold is the source of truth. After 180 days we mark it as outdated and suggest rechecking it.
- Garmin LT is used if it is no more than 120 days old and there is no priority confirmed value.
- Estimate is the fallback. For heart rate:
threshold heart rate ≈ 0.9 × maximum heart rate over the last 180 days.
In the review by Seiler and Tønnessen (2009), a range of 0.85–0.92 of maximum heart rate is considered for trained athletes; we use 0.9. If there is no actual maximum in the activities, we use the formula by Tanaka, Monahan and Seals (2001):
HRmax = 208 − 0.7 × age
The spread is about ±10 beats, so such a formula does not become a personal measurement. We mark the calculated threshold with the word “estimate” both in the card and in the coach's answers.
If there is no confirmed threshold running pace and no Garmin LT, we take the prediction for the distance closest to 60 minutes. The basis is Jack Daniels' practical guideline in Daniels’ Running Formula: threshold pace is held for about an hour. We estimate critical swimming speed from actual swims — as the slope of the “distance — time” line according to the Wakayoshi approach.
From the day's load to CTL, ATL and TSB
The basis is the impulse-response model by Banister (1975, 1991), and the practical shape of the curves comes from Coggan and TrainingPeaks. A workout simultaneously adds long-term fitness and short-term fatigue, but these effects fade at different rates.
We add up the accounted loads for the day and update the curves:
CTL(t) = CTL(t−1) + (day's load − CTL(t−1)) · (1 − e^(−1/42))
ATL(t) = ATL(t−1) + (day's load − ATL(t−1)) · (1 − e^(−1/7))
TSB(t) = CTL(t−1) − ATL(t−1)
The CTL time constant is 42 days, and the ATL time constant is 7 days. This is exponential smoothing, not an average over a fixed window: old workouts gradually lose weight rather than disappearing from the calculation on a specific day.
We calculate TSB using yesterday's curves. This is the freshness with which a person enters today. Otherwise, today's workout would instantly change the morning reading: the same morning would look different depending on whether the watch had synced yet.
A day without workouts is a load of 0, not a missed entry. Both curves decline, ATL faster. If we skipped over empty days, during illness form wouldn't drop, and rest would look like maintaining the previous load.
For the ramp-up, we calculate the curves wider than the visible window: we use four CTL time constants, i.e. 168 days. Over this time, the exponential reaches 98% of the plateau at a constant load. This way, the start of the displayed chart depends less on an artificial zero. The left-edge error cannot be completely eliminated: we don't know the history before the first entry. When starting from zero, the unaccounted prehistory always underestimates form.
Yoga and stretching receive a heart rate estimate and remain in the log, but are not included in CTL and ATL. The same applies to mobility, breathing practices, and meditation. An hour of stretching should not stand on par with an hour at threshold in the training preparedness model.
How we protect the chart from corrupted inputs
A correct formula doesn't fix incorrect data. In real-world data, I found a "run" of 189 km in 2:45 with a merged track, rTSS 8519, and also a trail slower than threshold with an intensity of 1.88 due to overlapping laps. Without checks, such entries break the chart for a long time.
We added limits:
- Average speed: the limit for running is 7 m/s, cycling — 17 m/s, swimming — 2.2 m/s. Above that, we don't trust the distance and pace, switch to heart rate, and mark the workout as suspicious. For scale: the world record for the marathon is about 5.7 m/s. This is a data filter, not a statement about human limits.
- Grade: we clamp it to ±30%. Minetti measured up to ±45%, but our elevation is noisy. A single segment with a "40% grade" after fourth-power averaging can outweigh the rest of the workout.
- Normalized speed: if it exceeds the average by more than 1.5 times, we take the average. Almost always this is corrupted splits, not ragged intervals. Here, underestimating the score is safer than producing an impossible load.
- Intensity by duration: the ceiling is 1.15 for work lasting an hour or more, 1.30 — from 20 minutes, 1.50 — for shorter work. IF = 1 corresponds to roughly an hour of threshold work. Noticeably above one at such a duration is a reason to suspect the inputs or an underestimated threshold; the margin up to 1.15 is left partly for an estimated threshold.
- Single time base: we take duration and intensity from one source — the sum of segments. You can't estimate intensity from moving time and then multiply it by the full time including stops.
What this gives the athlete
In the card, we show the following TSB zones:
- Below −30 — severe fatigue. This is what overload looks like in the model; it's time to plan a recovery week.
- From −30 to −10 — accumulated fatigue. A normal situation in a build block, but not the goal before a race.
- From −10 to +5 — working state. The usual training mode.
- From +5 to +25 — freshness. A suitable state for a race or a hard workout according to the model's scale.
- Above +25 — rest has dragged on, form is fading. Freshness here no longer necessarily means readiness to perform well.
This is standard PMC practice, not physiological thresholds. The numbers themselves have no separate physiological meaning. You find your own "race-day" TSB from your own races: comparing the chart, how you felt, and how the race went.
For CTL growth there is a Coggan guideline — no more than 5–8 points per week. This is not a safety rule: slower growth does not guarantee that the load is appropriate. The point of the hint is not to ramp up volume faster than you can absorb it. A sharp increase often results in illness or missed workouts. We show the weekly gain as a number, but we do not automatically block anything.
Taper uses different rates of decline for the curves. Over 7–14 days volume decreases while intensity stays. Fatigue fades faster than fitness — time constants of 7 versus 42 days. That is why freshness rises while accumulated fitness changes much more slowly. Extra hard work "for confidence" can interfere with exactly this process.
What this gives the AI coach
We calculate planned load with the same formula as actual load. That way plan and actual are compared on one scale, not by the words "easy" and "hard".
In the compact daily plan the coach sends three blocks: what to do, what to wear for the weather, and what the workout will do to your fitness. The last one looks like this, for example: "load 62; fitness 48 → 48.3, freshness −6 → −6.7". This is a projection based on unrounded source values, not a promise about how you will feel. Freshness after completing the workout already refers to the next day.
The projection uses the same exponentials as the actual data: if actual load matches planned load, the curve calculation will match too. If the workout was shortened or done differently, the chart is recalculated from actual data. We are currently building a separate "plan → actual → fitness" review feature; we are not promising timelines.
Another task is checking thresholds. If Garmin differs from our value by more than 5%, we suggest updating the threshold with a button rather than changing it silently. Substituting a threshold during recalculation can change your entire load history retroactively.
How this differs from TrainingPeaks
The Performance Management Chart was developed by TrainingPeaks and Coggan. Their terms are Fitness / Fatigue / Form; in our card these are fitness, fatigue, and freshness. NP, IF, and TSS are their registered metrics. We use the same foundation, but build a different product around it.
| Feature | TrainingPeaks | 1trAIner |
|---|---|---|
| PMC: CTL, ATL, TSB | Yes: 42 and 7 days, TSB based on yesterday's curves | Yes: same time constants and yesterday's TSB |
| Load across sports | TSS by power, hrTSS, rTSS, sTSS | Single scale: running adjusted for incline, cycling, swimming, TRIMP relative to one hour at threshold |
| NP, IF, TSS | Yes, registered metrics | Calculated from splits, not from second-by-second streams |
| Pa:Hr — heart rate and pace decoupling | Yes | Yes, on workouts of 45 minutes or more |
| Annual plan | ATP: planned volumes and planning by TSS | Yes, written by AI; no annual TSS-based planning like ATP |
| Planned PMC curve forward | Yes | No; a single-workout projection does not replace it |
| Peak performances and power | Peak Performances, mean max power curve | No peak power curves |
| Structured workouts | Yes, with sending to the watch | Yes, export as a file; automatic sending to Garmin is disabled until the owner approves |
| Coach | Platform for a human coach; separate plans with a coach from $149/month. Premium does not include our AI coach scenario | No human coach. AI builds and rewrites the plan, reviews workouts, and replies in chat |
| Price and free trial | Premium: $19.95/month or $134.99/year, 14 days free — pricing page, September 2026 | 450 ₽/month or 4999 ₽/year, 7 days free |
TrainingPeaks is a registered trademark of the respective company. We do not consider ourselves a replacement for their analytics and do not compete with the depth of their power analysis. The difference is elsewhere: theirs is a tool for you and your coach, ours has the coach built in.
An important accuracy limitation: we do not have second-by-second power and pace streams — Garmin provides time in zones and splits. We calculate normalized values from segments: on steady rides this almost matches classic NP, on choppy intervals it underestimates. The overall formula does not eliminate this loss of detail.
The load model is a conversational scale, not a medical assessment. It only counts workouts and knows nothing about sleep, stress, or illness. Focus on how you feel, and if you have pain or feel unwell, consult a doctor.
Sources
- Banister E.W., Calvert T.W. Planning for future performance: implications for long term training (1975); Banister E.W. Modeling elite athletic performance (1991).
- Morton R.H., Fitz-Clarke J.R., Banister E.W. Modeling human performance in running. J Appl Physiol, 1990.
- Minetti A.E. et al. Energy cost of walking and running at extreme uphill and downhill slopes. J Appl Physiol, 2002.
- Wakayoshi K. et al. Determination and validity of critical velocity as an index of swimming performance in the competitive swimmer. Eur J Appl Physiol, 1992.
- Skiba P. Calculation of Power Output and Quantification of Training Stress in Distance Runners: The Development of the GOVSS Algorithm, 2006.
- Tanaka H., Monahan K.D., Seals D.R. Age-predicted maximal heart rate revisited01054-8). JACC, 2001.
- Seiler S., Tønnessen E. Intervals, Thresholds, and Long Slow Distance, 2009.
- Allen H., Coggan A. Training and Racing with a Power Meter, VeloPress, 2006.
- Daniels J. Daniels’ Running Formula, Human Kinetics.
- TrainingPeaks: What is the Performance Management Chart.
- TrainingPeaks: Normalized Power, Intensity Factor and Training Stress Score.
- TrainingPeaks: Estimating Training Stress Score (TSS).
- TrainingPeaks: The Comprehensive Guide to Creating an Annual Training Plan.
- TrainingPeaks: A Look at Planning by TSS With the New ATP.
- TrainingPeaks: All About the Mean Max Power Curve.
- TrainingPeaks: Aerobic Decoupling.
- TrainingPeaks: pricing.